

Delve in to the social history behind the streets we live in and it doesn’t take long for the maps of Victorian philanthropist Charles Booth to crop up. His vast project, Life and Labour of the People, (more commonly known as Booth’s Poverty Map), took him an epic seventeen years to complete, from 1886 to 1903.
The results were hugely important, presenting facts on the true amount of deprivation in London for the first time, and to a society used to viewing the city through Charles Dickens’ more lyrical take on the rich/poor divide.
In 1898, Booth’s study came to Kentish Town. A series of walks in the company of Inspector Tomkin of the local police generated some fascinating notes about an environment we’d physically recognise much of today.
It was the year iconic local watering hole the Assembly House was rebuilt in its current, turreted form and much of the railway, the shop fronts and terraced housing were already in place too.

As we have noted before, this area reflects its past through more than just buildings, and Kentish Town of the late 19th century reveals itself to hold an optimistically diverse social mix. Sound familiar?
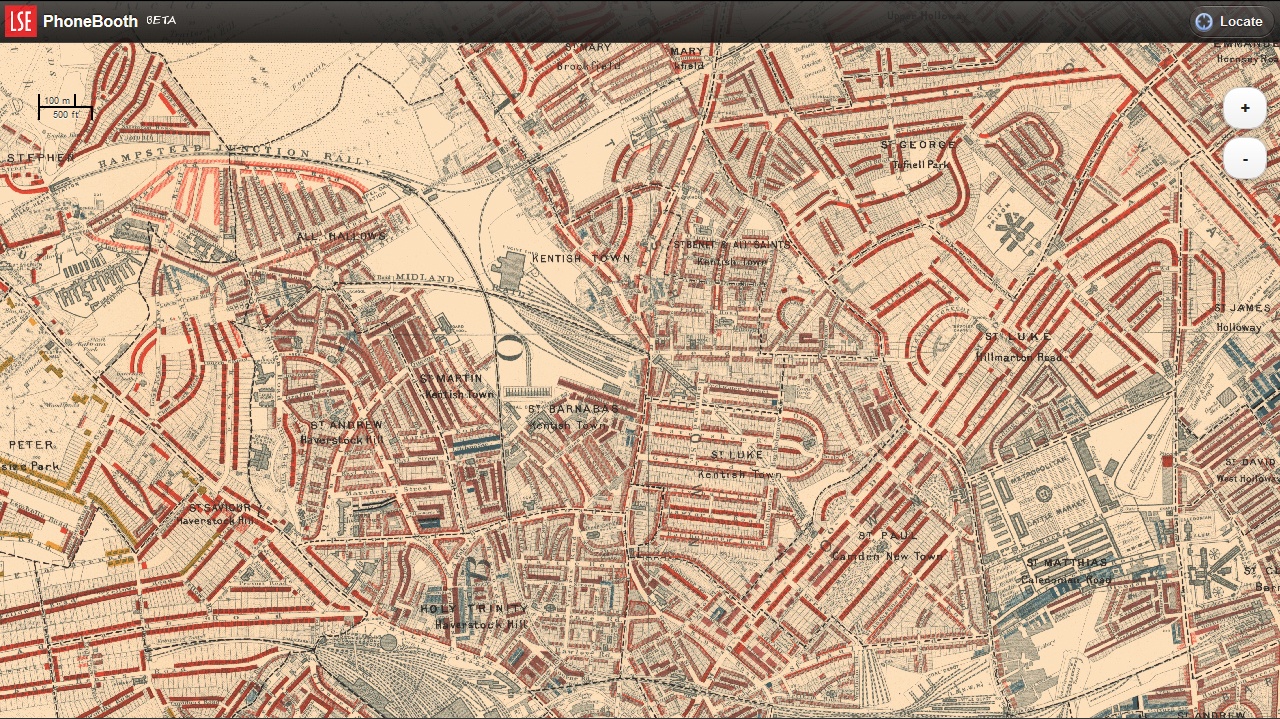
“Poverty remains the occasional and not the pervading characteristic,” read the notes. A rash of red, pink and purple colour coding awarded to the houses across much of the parish hotchpotch destined to become NW5.
These signify Booth’s ‘well to do’, ‘fairly comfortable’ and ‘mixed’ social categories, on a sliding colour scale all the way down to black; ‘vicious, semi-criminal.’ His terminology may sound ancient now, but presenting the findings in a simple, visual way was very forward thinking in his era.
In the same way that John Snow – whose 200th birthday is being widely celebrated this week – broke vital ground plotting the relationship between cholera deaths and water pumps in his seminal map of Soho some years earlier, Booth’s map was a forerunner of today’s easy-to-grasp infographics, pretty pie charts and beautiful computer generated data mapping. But Booth only had a notebook, so we can cut him some slack on the jarring vocabulary.

The local area looks really quite comfortable, compared to some of the maps of East London. Yet there is still, inevitably, the odd gentrification alert, if that’s what you’re after. Inkerman Road has certainly come up in the last 115 years. “Houses, roughish, some of them. 2 or 3 prostitutes living in the basements on the N side S.W of Cathcart St, but no brothels,” tell the notes. Before presenting the full extent of the impoverished set-up: “The women widows, with families, who ply their trade to eke out earnings.”
Neighbouring Alma Street however is already seen as “very decent indeed,” even with two families to the average little house there. As usual, the area is apparently on the proverbial up, with one resident declaring the old chestnut – then, as now – “Kentish Town is not half as rough as it was ten years ago.”
LSE have a whole website devoted to Booth, scans of his notes and those extensive maps of London. The best version is the mobile one (seen above) where you can overlay the 1898 map onto modern day Kentish Town for a satellite snapshot of how the area has – or indeed hasn’t – changed socially.

The Open University also have study guides tied to last year’s excellent BBC series Secret History of Our Streets, which show that while areas of historic poverty and deprivation remain, life has improved immeasurably for all of us since Booth’s days, not really so very long ago.
As have the tools for presenting data, too. Booth trod the streets for the best part of two decades to produce his clever stats visualisations. Phylis Pearsall, she of the A-Z atlas, walked over 3000 miles and sketched for up to 18 hours a day to produce her once-essential book. And Harry Beck – Mr Tube Map – painstakingly revised his line drawings endless times over years to create the famous guide we still use today.
Today we’re positively swimming with data – how many people have checked in on FourSquare at Pizza East today? – but still need clever visual ways of it making sense, perhaps even more so no we generate so much of it.
But all the apps and pretty diagrams don’t beat a set of notes which are, at once, as much a reflection of a particular social era as they are a commentary on it. The nation’s collective hang-up with class carries on, as new generations of Kentishtowners play out their various parts in the machine. Nice part of town for it, anyway. Say the notes:
“No fighting or brawling; no drunken women; only two drunken men (one asleep on the pavement in Weedington Road and a second reeling down Raydon Street, but clearly coming from the bad nest of streets outside the sub-division); and only one bare-footed child, a boy of 12 or 13 in Haverstock St off Ferdinand St.”
Sounds like home.
Words: Tom Kihl
LSE Charles Booth Online Archive
Phone Booth Mobile site
New York Times: An Early Triumph of Information Design
Open University – Secret History of Our Streets worksheets